BitcoinReversal Research · Study 01
When Bitcoin Cycle Models Disagree
A reproducible comparison of valuation references, moving averages, historical opportunity and public attention.
The central result: from 1 January 2021 to 11 September 2026, Bitcoin closed on opposite sides of our Power Law and Stock-to-Flow references on 521 of 2,080 days (25.05%). In 2025 alone, that occurred on 312 of 365 days (85.48%).
These are descriptive comparisons of the specified references. They are not trading returns or evidence that either model predicted those days in advance.
Different questions can produce different answers
A price trend, a scarcity formula, a moving-average crossover and an attention index do not measure the same thing. Treating them as five votes on one buy-or-sell decision hides their definitions. This study makes the differences explicit, using one completed observation date and a frozen dataset that readers can inspect.
The original contribution is the synchronized comparison and the measured frequency with which two published reference formulas place the same Bitcoin close on different sides of their curves. We use BitcoinReversal’s documented implementations and credit the original model concepts. We do not compare commercial platforms or claim that one indicator is universally best.
One completed day, five readings
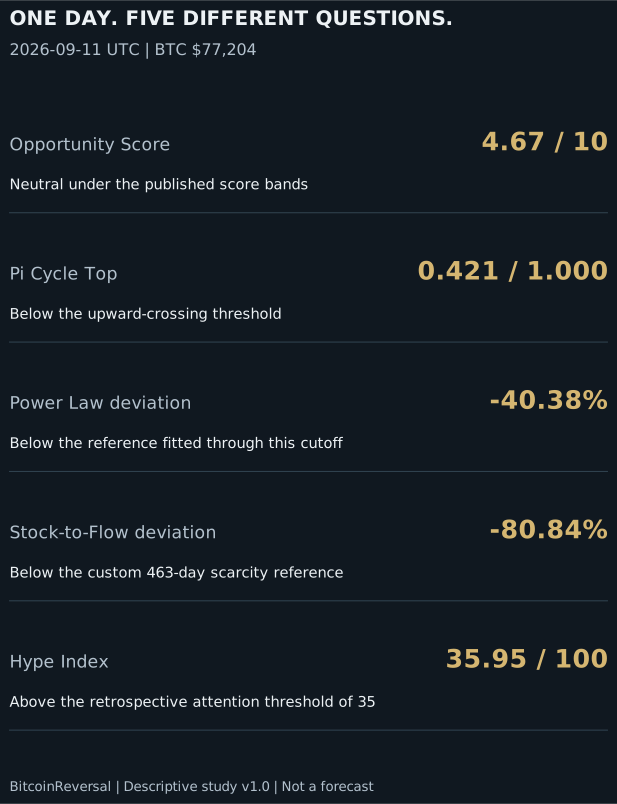
At the common cutoff, Bitcoin’s stored UTC close was $77,203.59. The readings describe several distinct conditions:
- Opportunity Score: 4.67/10. Neutral under the published score bands; a historical ranking rather than a probability.
- Pi ratio: 0.421. Below 1.000, with no upward crossover on the selected date. That does not rule out a price peak.
- Power Law: -40.38%. Price below the reference fitted through this study’s cutoff.
- Stock-to-Flow: -80.84%. Price below the custom scarcity reference; this is not a promised reversion target.
- Hype Index: 35.95/100. Above the published attention threshold of 35, which is applied retrospectively.
A reading can therefore show price below a fitted reference while attention is above its chosen threshold. Neither observation cancels the other.
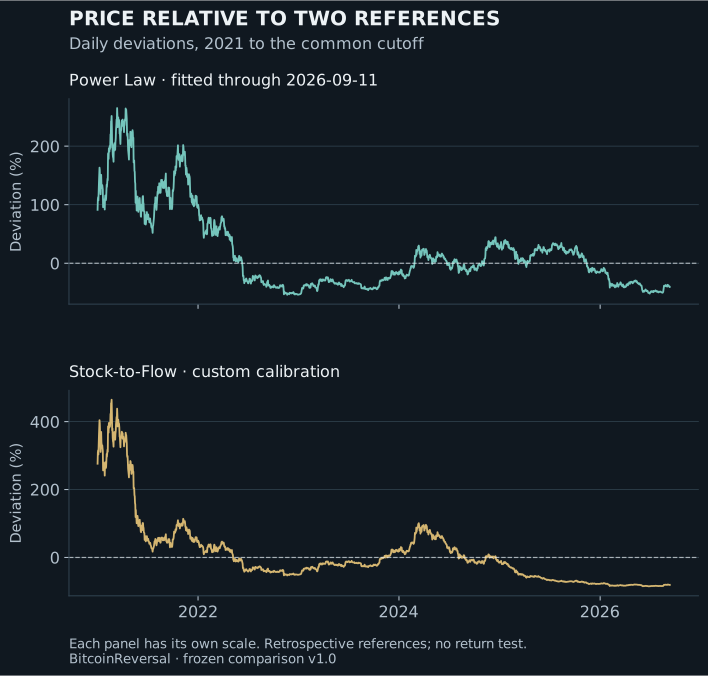
How often do the price references disagree?
For each completed day, we calculate the close’s percentage deviation from each reference. We count a day when one deviation is negative and the other is non-negative. This is a deliberately narrow definition of disagreement: it describes the position of price, not the likely direction of its next move.
Deviation (%) = 100 × (Bitcoin close ÷ model reference − 1)
The 2025 result is particularly instructive. The median daily deviation was +19.80% for the cutoff-fitted Power Law reference and −66.39% for the custom S2F reference. The medians summarize different reference levels; they are not annual Bitcoin returns. Across all 2,080 days, the opposite-side frequency was 25.05%.
| Year | Days | Power Law median deviation | S2F median deviation | Opposite-side days | Share |
|---|---|---|---|---|---|
| 2021 | 365 | +135.89% | +93.34% | 0 | 0.00% |
| 2022 | 365 | -23.47% | -29.96% | 33 | 9.04% |
| 2023 | 365 | -34.74% | -20.09% | 52 | 14.25% |
| 2024 | 366 | +2.44% | +18.90% | 124 | 33.88% |
| 2025 | 365 | +19.80% | -66.39% | 312 | 85.48% |
| 2026 YTD | 254 | -37.99% | -82.25% | 0 | 0.00% |
Two references can agree on the sign and still differ greatly in magnitude, as the cutoff readings demonstrate. Conversely, opposite signs do not establish which reference is more useful. That would require a separately specified question, decision rule and evaluation period.
Exactly how this comparison was built
- Freeze the sources. Public API responses were retrieved on 13 September 2026. The common endpoint was 11 September, the latest BHI date with captured component verification at retrieval. Later observations and projected rows were excluded.
- Use one price series. We checked the overlapping closes across the Pi, Opportunity and S2F responses. The price history contains 5,730 completed observations from 4 January 2011 through the cutoff.
- Refit Power Law only through that cutoff. Ordinary least squares fits log(price) to log(calendar days since 3 January 2009). The resulting coefficients are alpha = −36.3882816924 and b = 5.48929144148; reference = exp(alpha + b × ln(days)). This avoids importing 12 September into the common-date comparison, but the curve remains a retrospective full-sample fit.
- Retain the other published definitions. Pi uses the 111-day mean divided by twice the 350-day mean. S2F uses the published custom coefficient, exponent 3.36 and 463-day flow window. Opportunity and BHI use the frozen model outputs; this study does not retrain Opportunity or claim to reconstruct historical platform collection.
- Count the specified event. From the explicit boundary 1 January 2021 through the cutoff, count differing deviation signs and report annual medians. No future return, trading-cost assumption or optimized threshold enters this calculation.
The reproduction script verifies the frozen file hashes, recomputes Power Law and Pi, checks the deviation arithmetic and latest BHI average, and recreates the table and all three figures. It runs locally without fetching newer observations.
Coverage, timing and what the study establishes
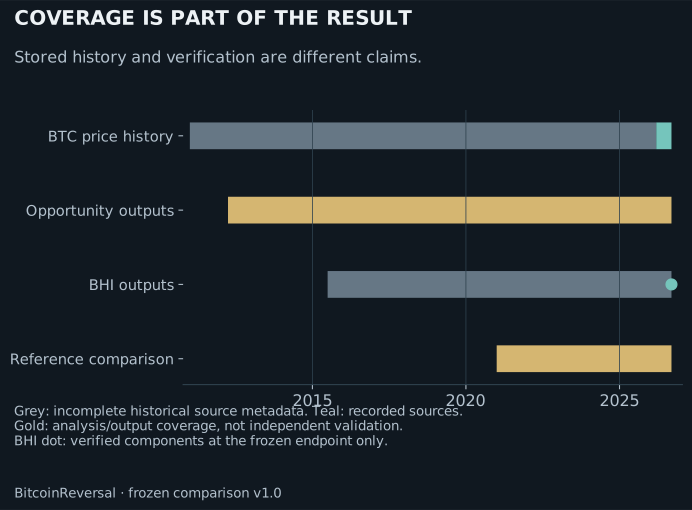
Publication delay is not a broken indicator. Wikipedia, Google and YouTube can become available at different times. The live BHI advances when all components for a later day are verified. This study retains its original cutoff even after the live index advances. For current dates, use the live source-status panel.
The older price import has no recorded original vendor or closing cutoff. From 14 March 2026, BitcoinReversal records the last available CoinGecko sample in each UTC day. Historical BHI collection and normalization metadata are incomplete. S2F’s inherited calibration has no documented independent validation. These properties limit what can be inferred from the history and are preserved in the download.
The study establishes how these specific implementations differ under a fixed dataset and transparent comparison rule. It does not establish profitable execution, predictive accuracy, causation, fair value, guaranteed reversion or the optimal combination of indicators. The figures contain no model projections beyond the observation cutoff.
Practical use: identify the question each chart answers, compare the same observation date and check its method before interpreting apparent agreement. A dated, inspectable reading is more useful than an unexplained consensus label.
Download and reproduce the study
Extract the ZIP, open a terminal in its folder and run python reproduce.py. The README provides dependency instructions. Expected result: 521 opposite-side days out of 2,080. Outputs appear in the reproduced folder.
The download reproduces this comparison from frozen prices and model outputs. It does not recreate undocumented historical raw collection. Third-party data retain their applicable source terms.
Methods and original concepts
- Opportunity Score — BitcoinReversal Recovery-6 v1, frozen model specification and interpretation.
- Pi Cycle Top — independent calculation; original indicator by Philip Swift, with original model reference.
- Power Law — published BitcoinReversal regression rules, building on Giovanni Santostasi’s original concept.
- Stock-to-Flow — custom BitcoinReversal calibration; PlanB’s original scarcity model is separately credited.
- Hype Index — normalized attention components, equal weighting and dated source status.
- BitcoinReversal Methodology — separate framework execution rules and historical-simulation limits.
Suggested citation: Dahlgren, Simon (2026). When Bitcoin Cycle Models Disagree: A Reproducible Comparison. BitcoinReversal, v1.0.0. Observations through 11 September 2026 UTC. Permanent article link.